dash.fun
Web3 · Consumer AIOpenServ · 2025
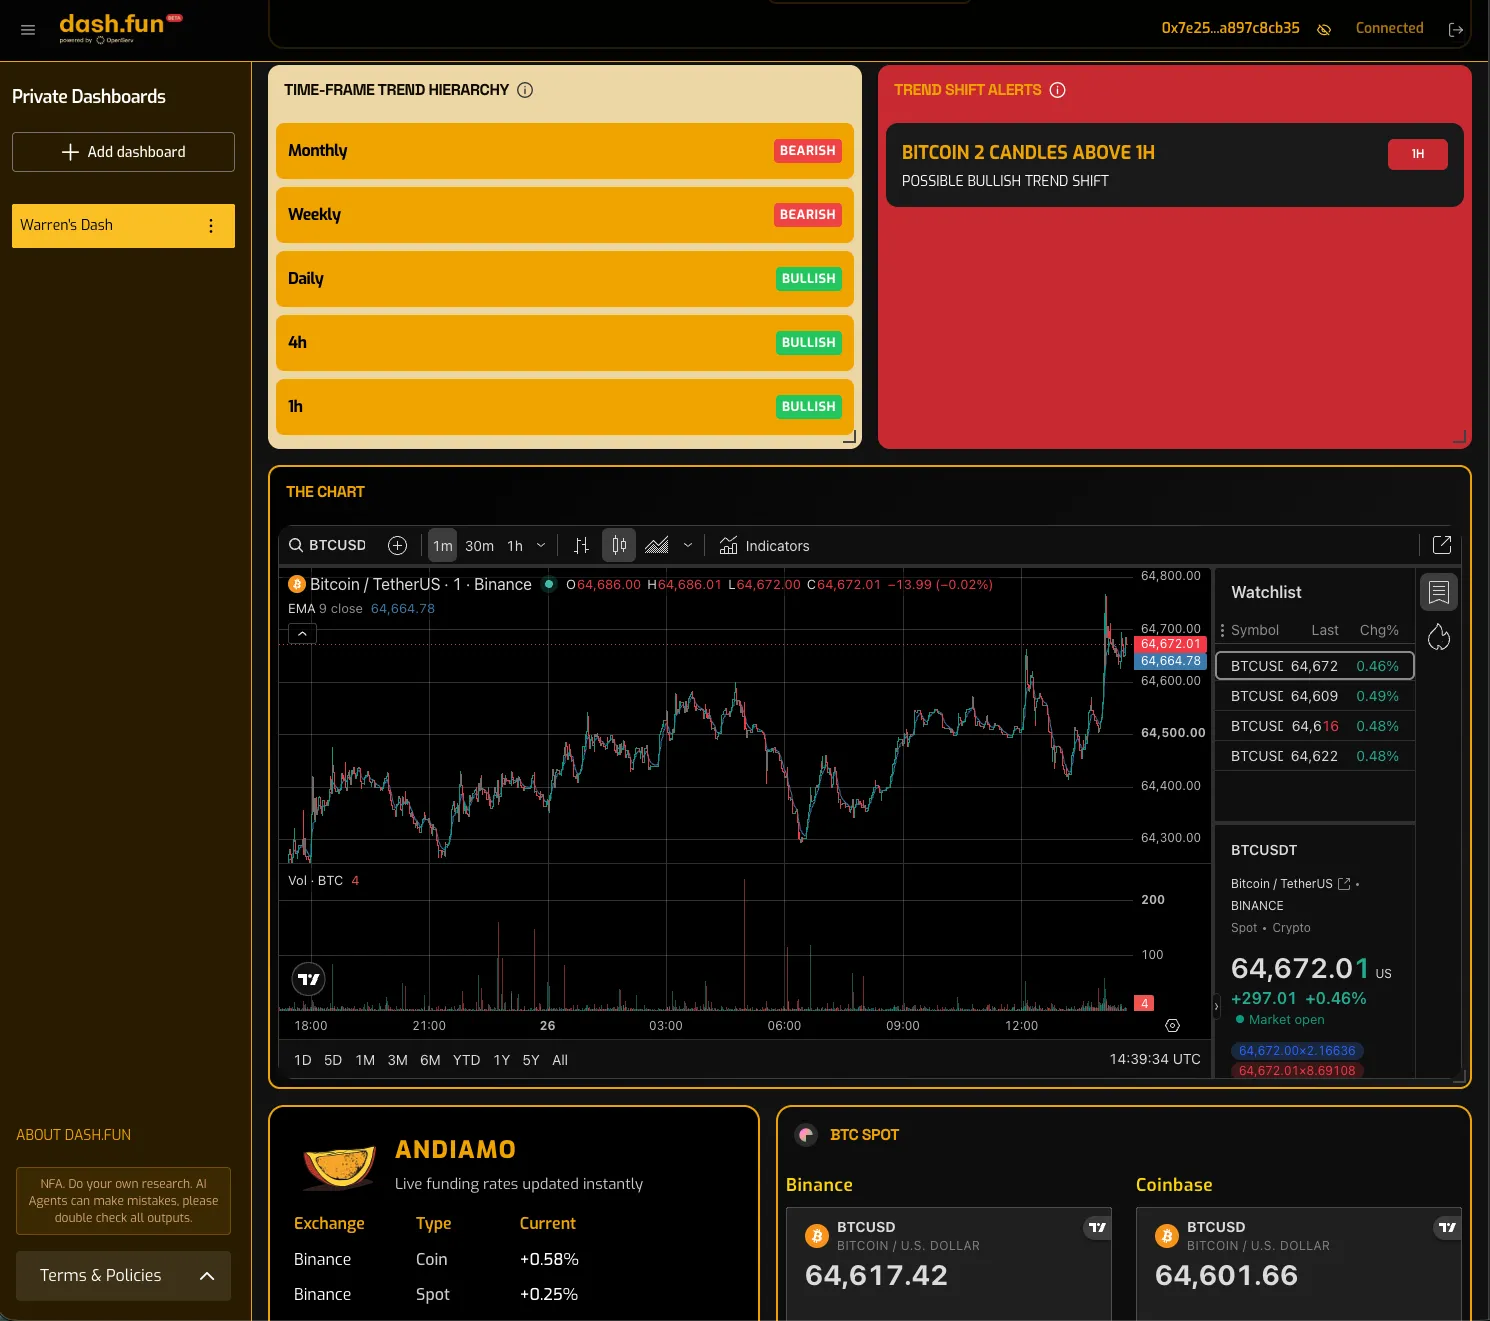
A customizable, real-time crypto-intelligence dashboard. Users compose a draggable grid of live tiles for market feeds, sentiment and attention heatmaps, token research, DeFi Q&A, technical analysis, and news, with several tiles powered by AI agents.
I helped consolidate live market data and AI analysis into a single consumer dashboard product.
Context
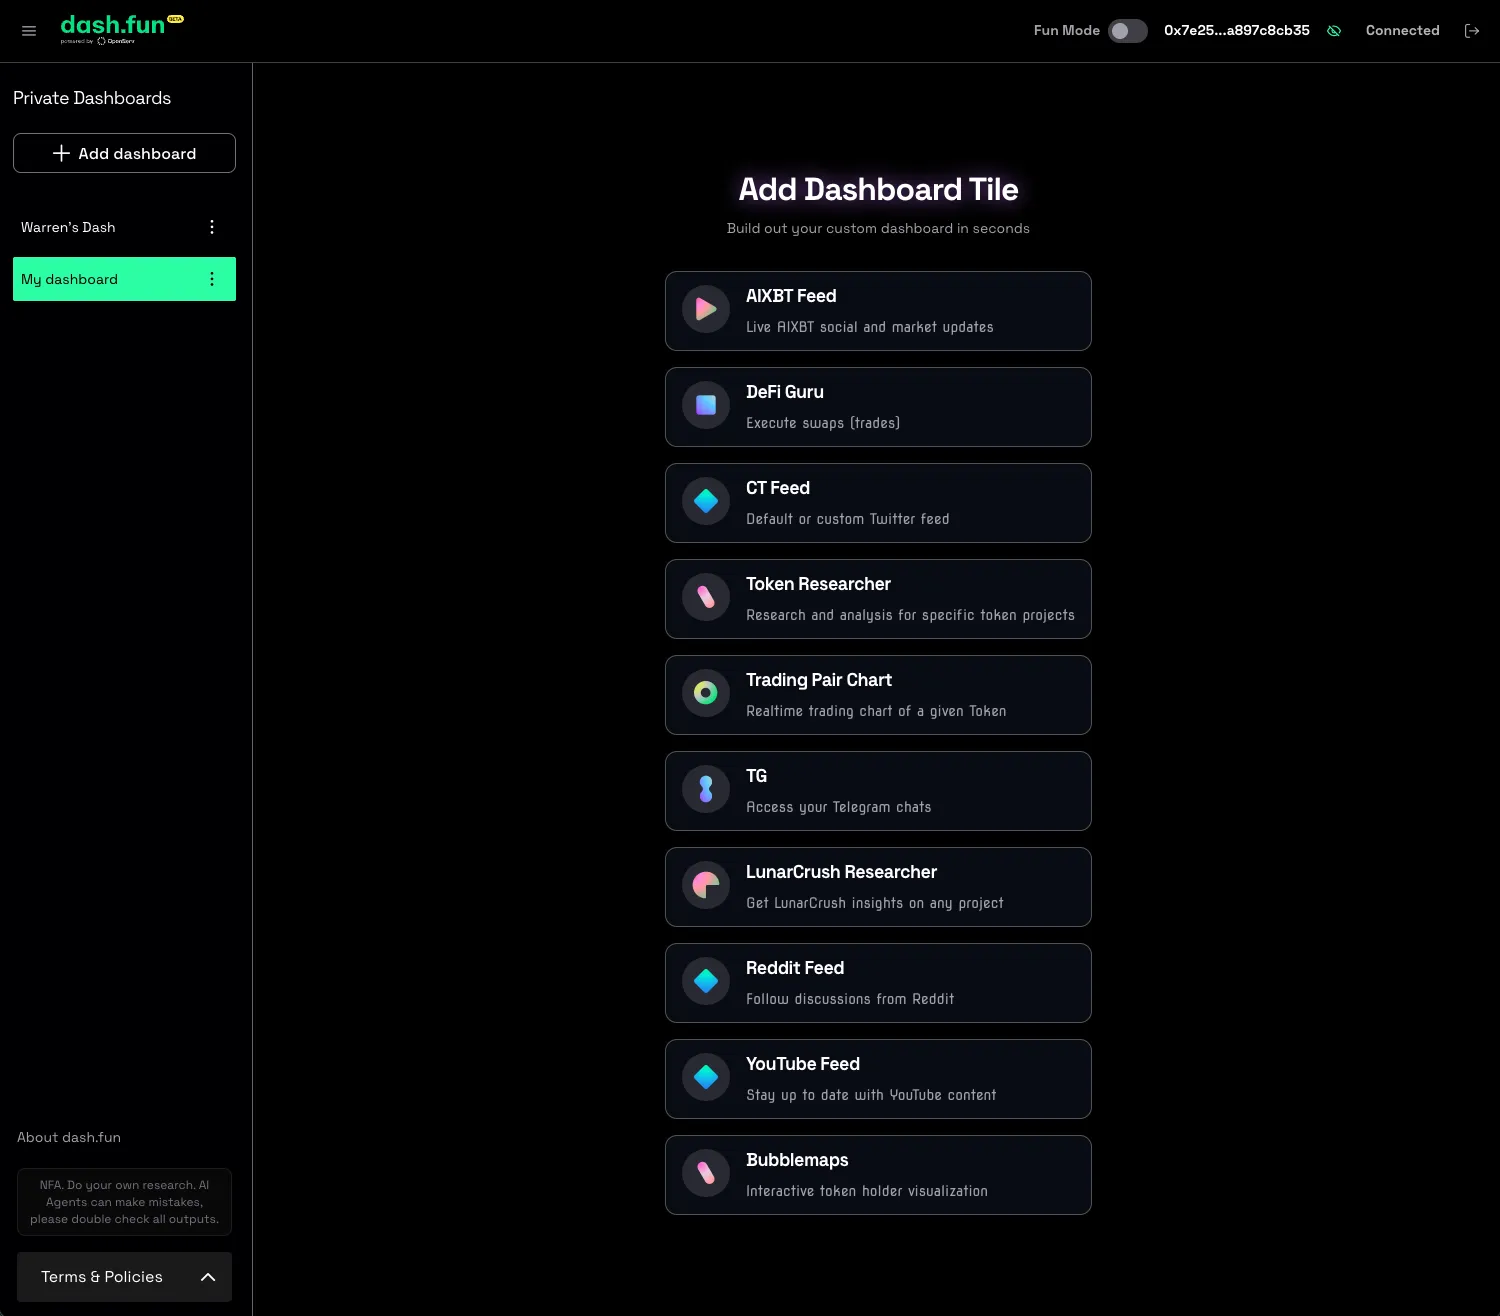
Crypto traders tend to juggle a dozen tabs: price feeds, funding rates, crypto Twitter, sentiment trackers, news, technical analysis. dash.fun consolidates them into one configurable dashboard of live tiles, several of them AI-powered agents that pull and summarize a specific data stream. There’s a crypto-signal feed, a crypto-Twitter feed, attention and token heatmaps, an AI token researcher, conversational DeFi Q&A, technical analysis, funding rates, and news. Users sign in with their crypto wallet and compose their own layout on a draggable, resizable grid.
The product is a two-package monorepo: a Vue 3 frontend and an Express/TypeScript backend where every tile follows the same module pattern of router, service, and model. Underneath sits a shared AI layer that orchestrates LangGraph graphs across OpenAI, Anthropic, and Gemini with Langfuse tracing. The product also works as a consumer-facing showcase of what OpenServ’s agents can do.
A note on current status: the project is no longer actively maintained, and its functionality is limited as of now.
My role
Full-stack engineer on the product. On the frontend that meant the dashboard grid, wallet onboarding, and live tile rendering. On the backend, the tile modules and the wallet-based authentication.
Highlights
- A tile system built for extension. Each dashboard widget maps to a backend module with a consistent router, service, and model shape, so new tiles slot into an established pattern; several tiles are backed by AI agents.
- Wallet-native onboarding. Users sign in with their crypto wallet (Sign-In with Ethereum) instead of a password.
- Multi-provider AI orchestration. LangGraph graphs run over OpenAI, Anthropic, and Gemini with Langfuse observability, streaming rich Markdown (with KaTeX math) to the UI.
- A live dashboard in the literal sense. TanStack Query keeps around 10 tiles updating, from social feeds to funding rates.
- Framework range. A production Vue 3 product from an otherwise React-heavy engineer: Options API, Pinia, PrimeVue, and the Vue editions of TanStack Query and wagmi.
Images